
GridBloom: electricity data you can check
A data pipeline, dashboard and weekly report built on public U.S. grid data. It checks every figure before showing it, says plainly when the data can't support a number, and adds an AI briefing whose every figure is verified against its sources.
A data pipeline, dashboard and weekly report on public U.S. grid data. It checks every figure, says plainly when the data can't support a number, and verifies every figure in its AI briefing.
- Project type
- Independent demonstration of the kind of work I do for clients whose projects stay private
- Data
- Public EIA hourly grid data for ISO New England, NYISO and PJM
- Built with
- Python, SQLite, FastAPI, React and the OpenAI API
- About the data
- Real historical observations, not live. No client data is involved.
An independent demonstration of the kind of work I do for clients whose projects stay private, built on public EIA data for ISO New England, NYISO and PJM. Real historical observations, not live, and no client data.
Why I built it
I built GridBloom on public data to show the kind of pipeline and reporting work I do for clients whose projects stay private. Using public electricity data means every part of it can be shown in full.
Most reporting problems aren't about charts. They're about inputs that arrive late, in different shapes, with gaps nobody mentions, and a summary someone has to trust. GridBloom covers that work end to end: importing uneven source data, deciding when a figure is trustworthy, and adding AI where it helps.
The U.S. Energy Information Administration publishes hourly demand and generation by fuel for every grid operator. It's rich data, and it's uneven in exactly the ways business data is.
I built GridBloom on public data to show the kind of pipeline and reporting work I do for clients whose projects stay private.
Most reporting problems are about inputs, not charts. GridBloom shows the whole job: importing uneven data, deciding when a figure is trustworthy, and adding AI where it helps.
Timing
Hours and days don't line up
Each value is labeled with the end of its hour in UTC. Daily totals have to follow New York calendar days, including 23- and 25-hour days when the clocks change.
UTC hour labels, New York calendar days and 23- or 25-hour clock-change days.
Coverage
Some data is missing or implausible
NYISO reports solar as zero in every hour, daylight included. ISO New England petroleum is missing on whole days. A dashboard that just adds up what it receives shows confident numbers that are wrong.
NYISO solar reads zero around the clock; ISO New England petroleum is missing on whole days.
AI
A summary must stay traceable
An AI summary is only useful if it keeps those qualifications and every figure in it can be traced back to the data.
Every figure in it has to lead back to the data.
From source data to a published number
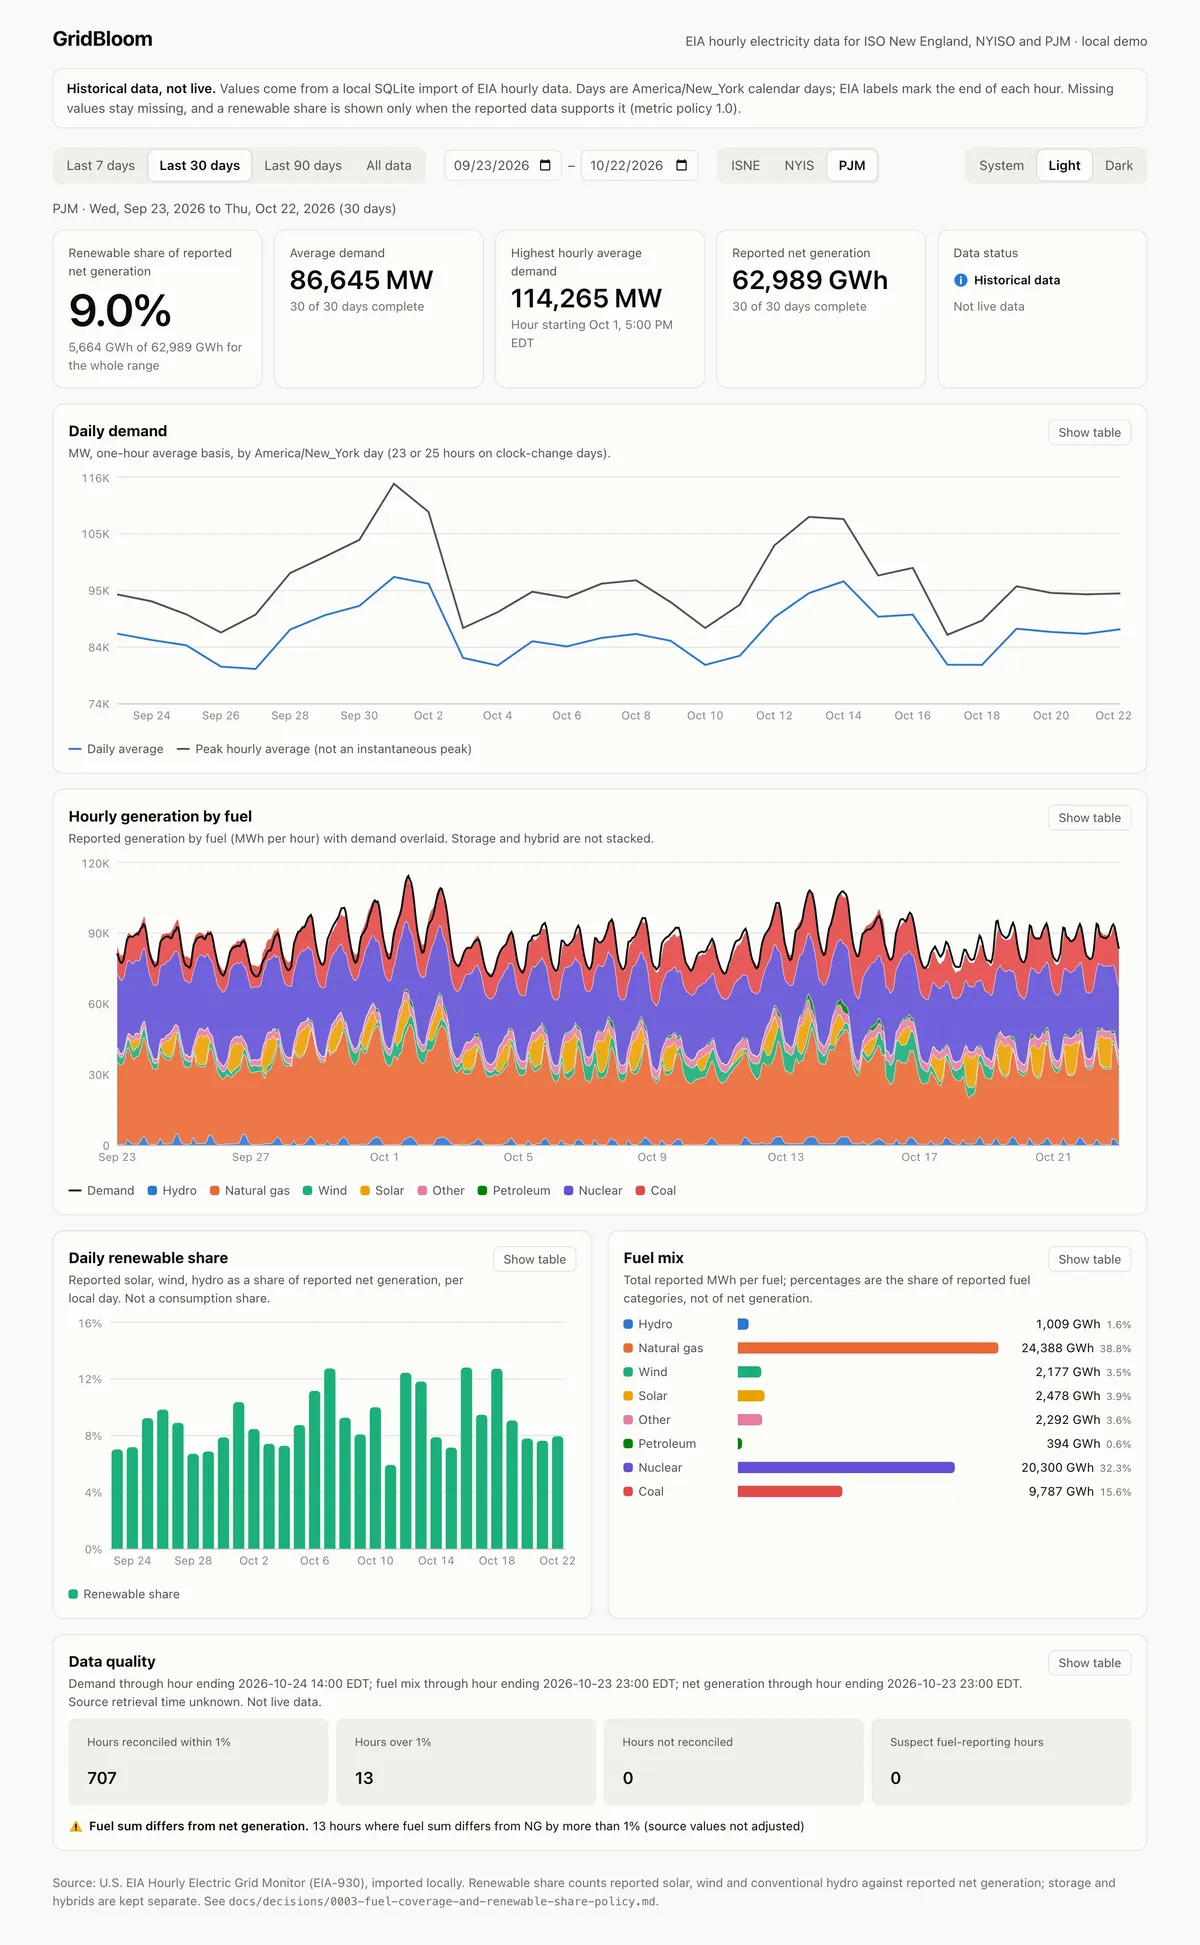
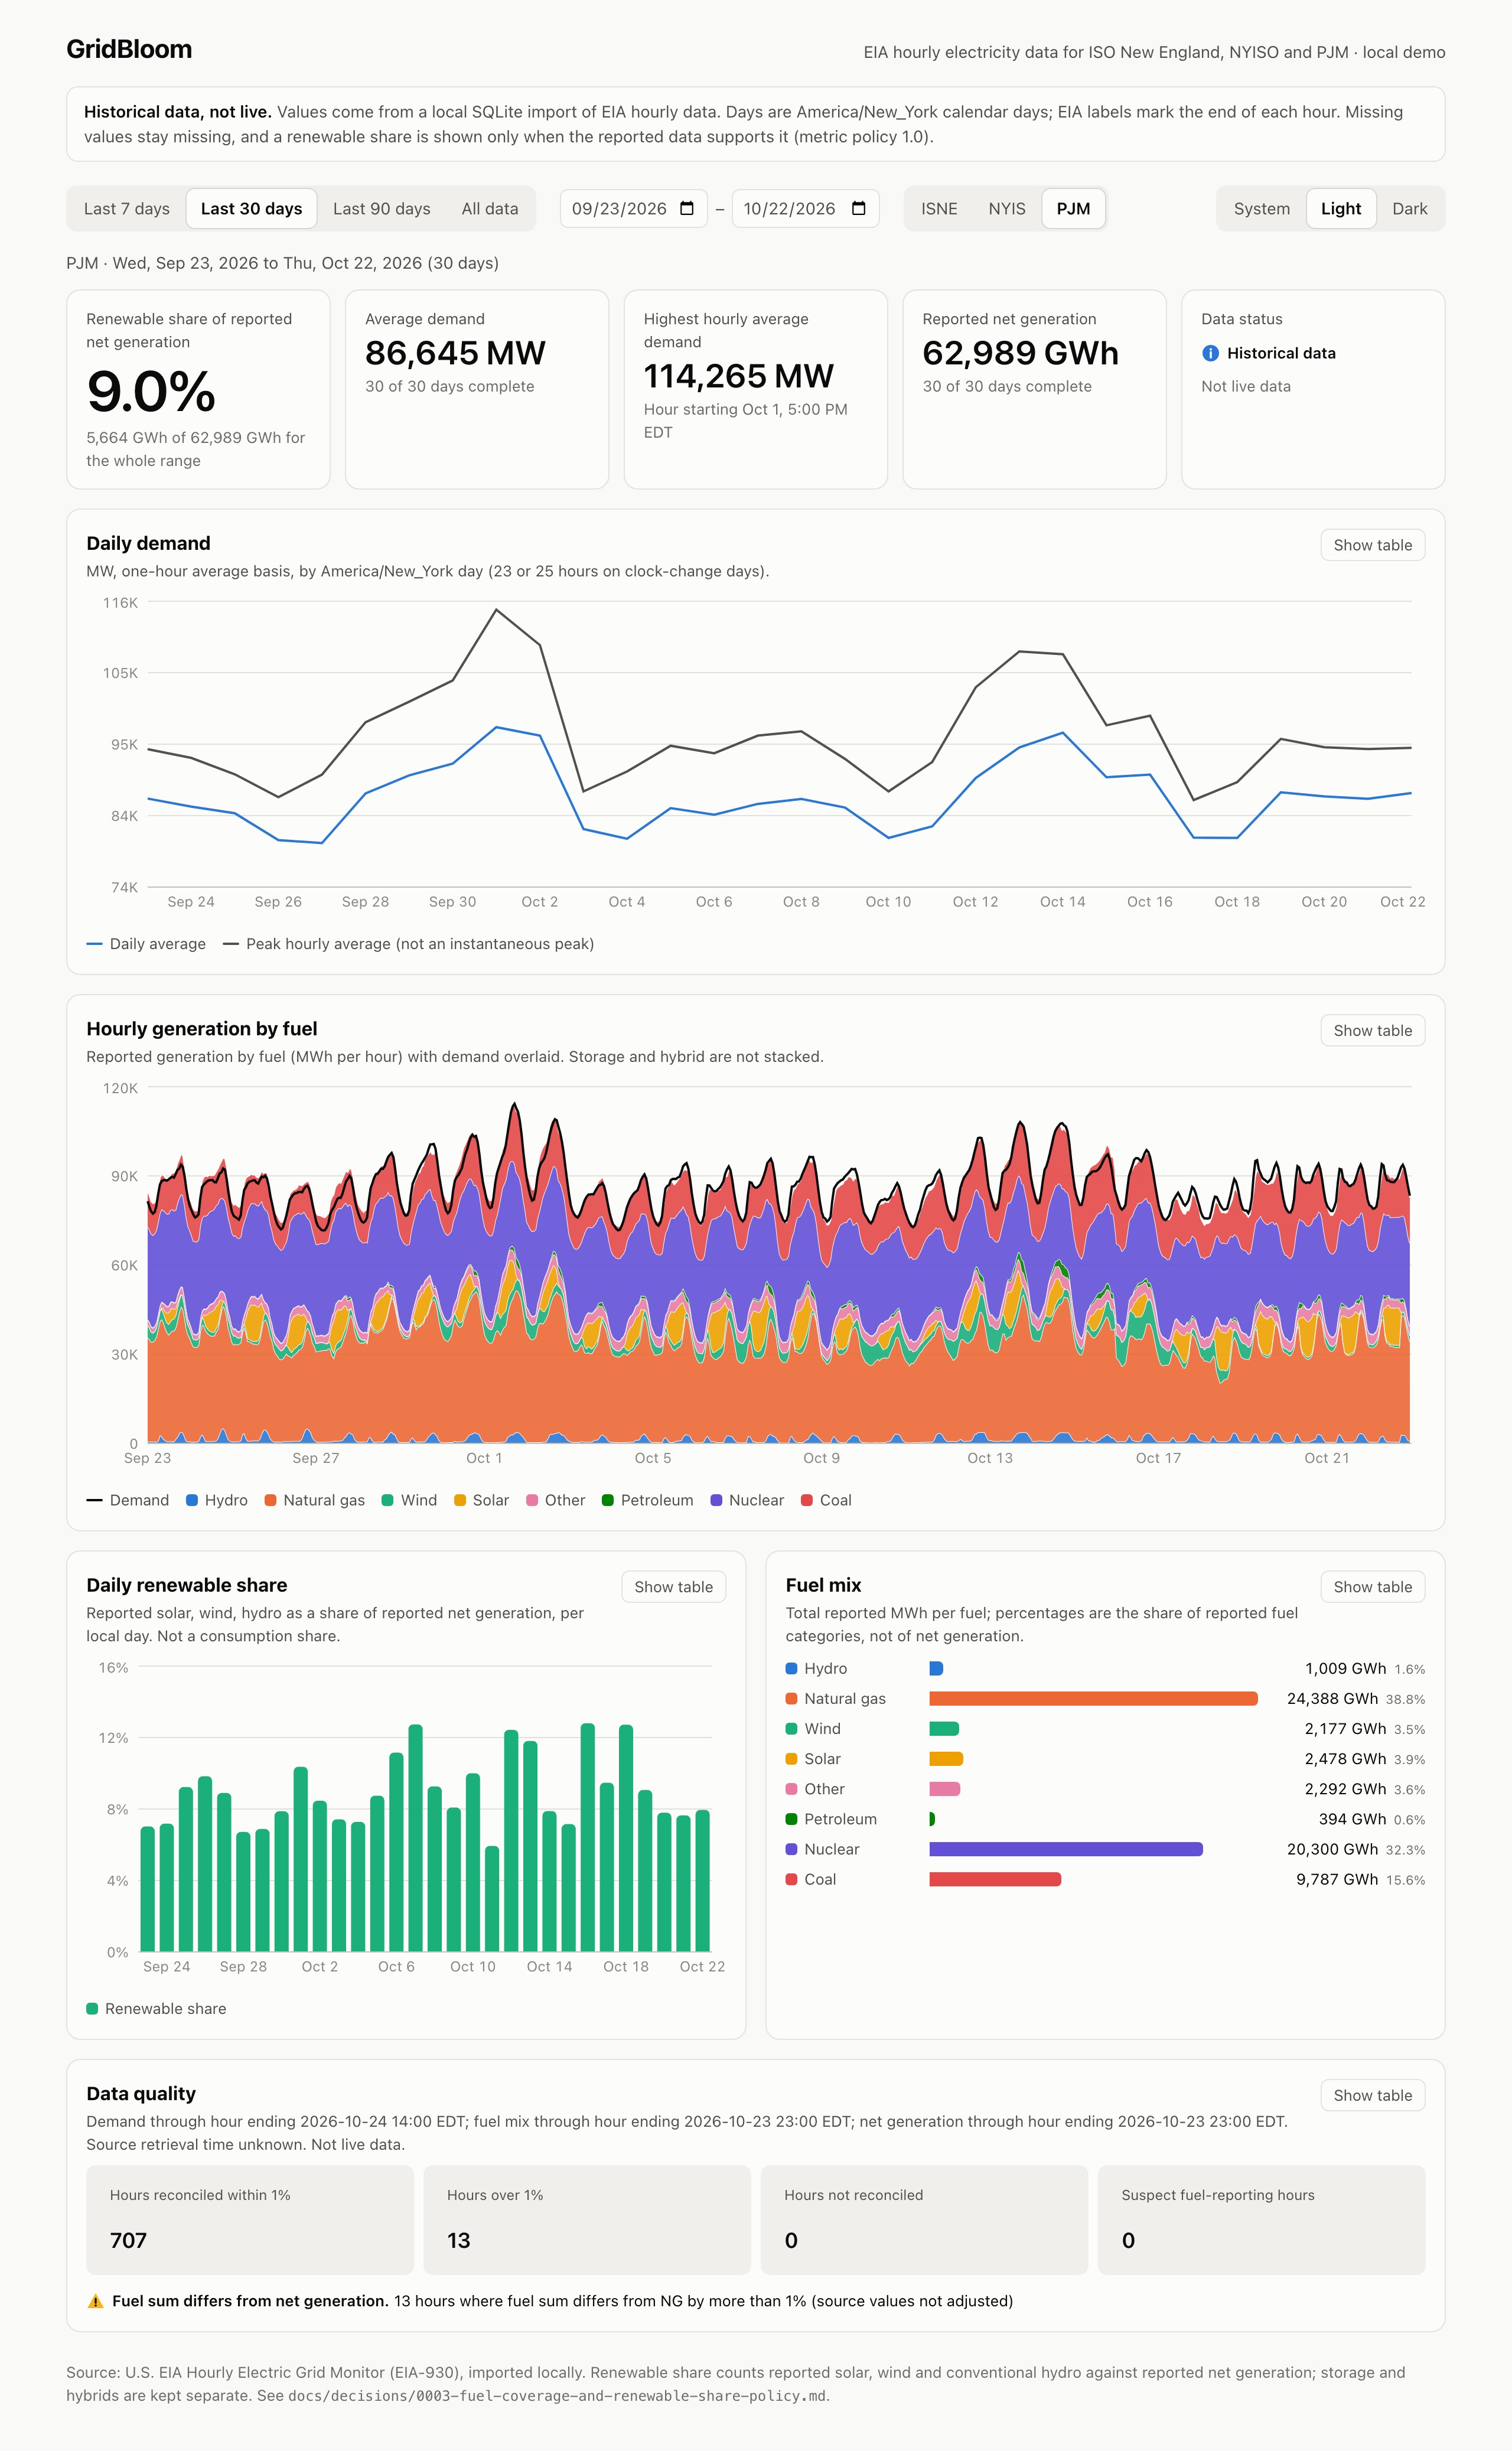
Every figure on the dashboard passes through the same four stages. The values in step 4 are from the PJM view above.
1 · Import
Load it with its history
- Observations
- 124,055
- Import runs
- 63
- Each value keeps
- Source, unit, hash
- Observations
- 124,055
- Import runs
- 63
An API week and a six-month bulk extract. Re-importing unchanged data changes nothing.
2 · Audit
Measure the gaps first
- Overlap checked
- API vs bulk
- Values compared
- 4,872
- Mismatches
- 0
- API vs bulk
- 4,872 compared
- Mismatches
- 0
A history audit records missing hours, fuel categories and timing before any metric is built.
3 · Policy
Apply written rules
- Rules kept in
- Versioned file
- Fuels vs total
- Flag over 1%
- Too little data
- Withheld
When a share may be published is a documented decision, not a hidden code branch.
A versioned policy decides when a share may be published.
Not enough data? The figure is withheld with the reason.
4 · Dashboard
Show it, with its limits
- Renewable share
- 9.0%
- Avg demand
- 86,645 MW
- Net generation
- 62,989 GWh
- Renewable share
- 9.0%
- Avg demand
- 86,645 MW
Served read-only. Every chart has a table view and every gap stays visible.
When the data can't support a number, nothing is estimated
At step 3, NYISO's renewable share is withheld because its solar is reported as zero around the clock. The dashboard shows "Insufficient coverage" and the reason, instead of a partial percentage that looks precise.
The dashboard
Pick a grid operator and a date range to see demand, generation by fuel, renewable share and a data quality summary. Missing hours are shaded, suspect hours are hatched, and fuel totals that disagree with reported generation by more than 1% are flagged rather than adjusted.
A Data pipeline panel reads the database's own import records: each source, how many runs succeeded, how many values were new, revised or unchanged, and the latest hour stored for every series.
Demand, generation by fuel, renewable share and data quality for any period. Gaps are shaded, suspect hours hatched, and every chart has a table view.
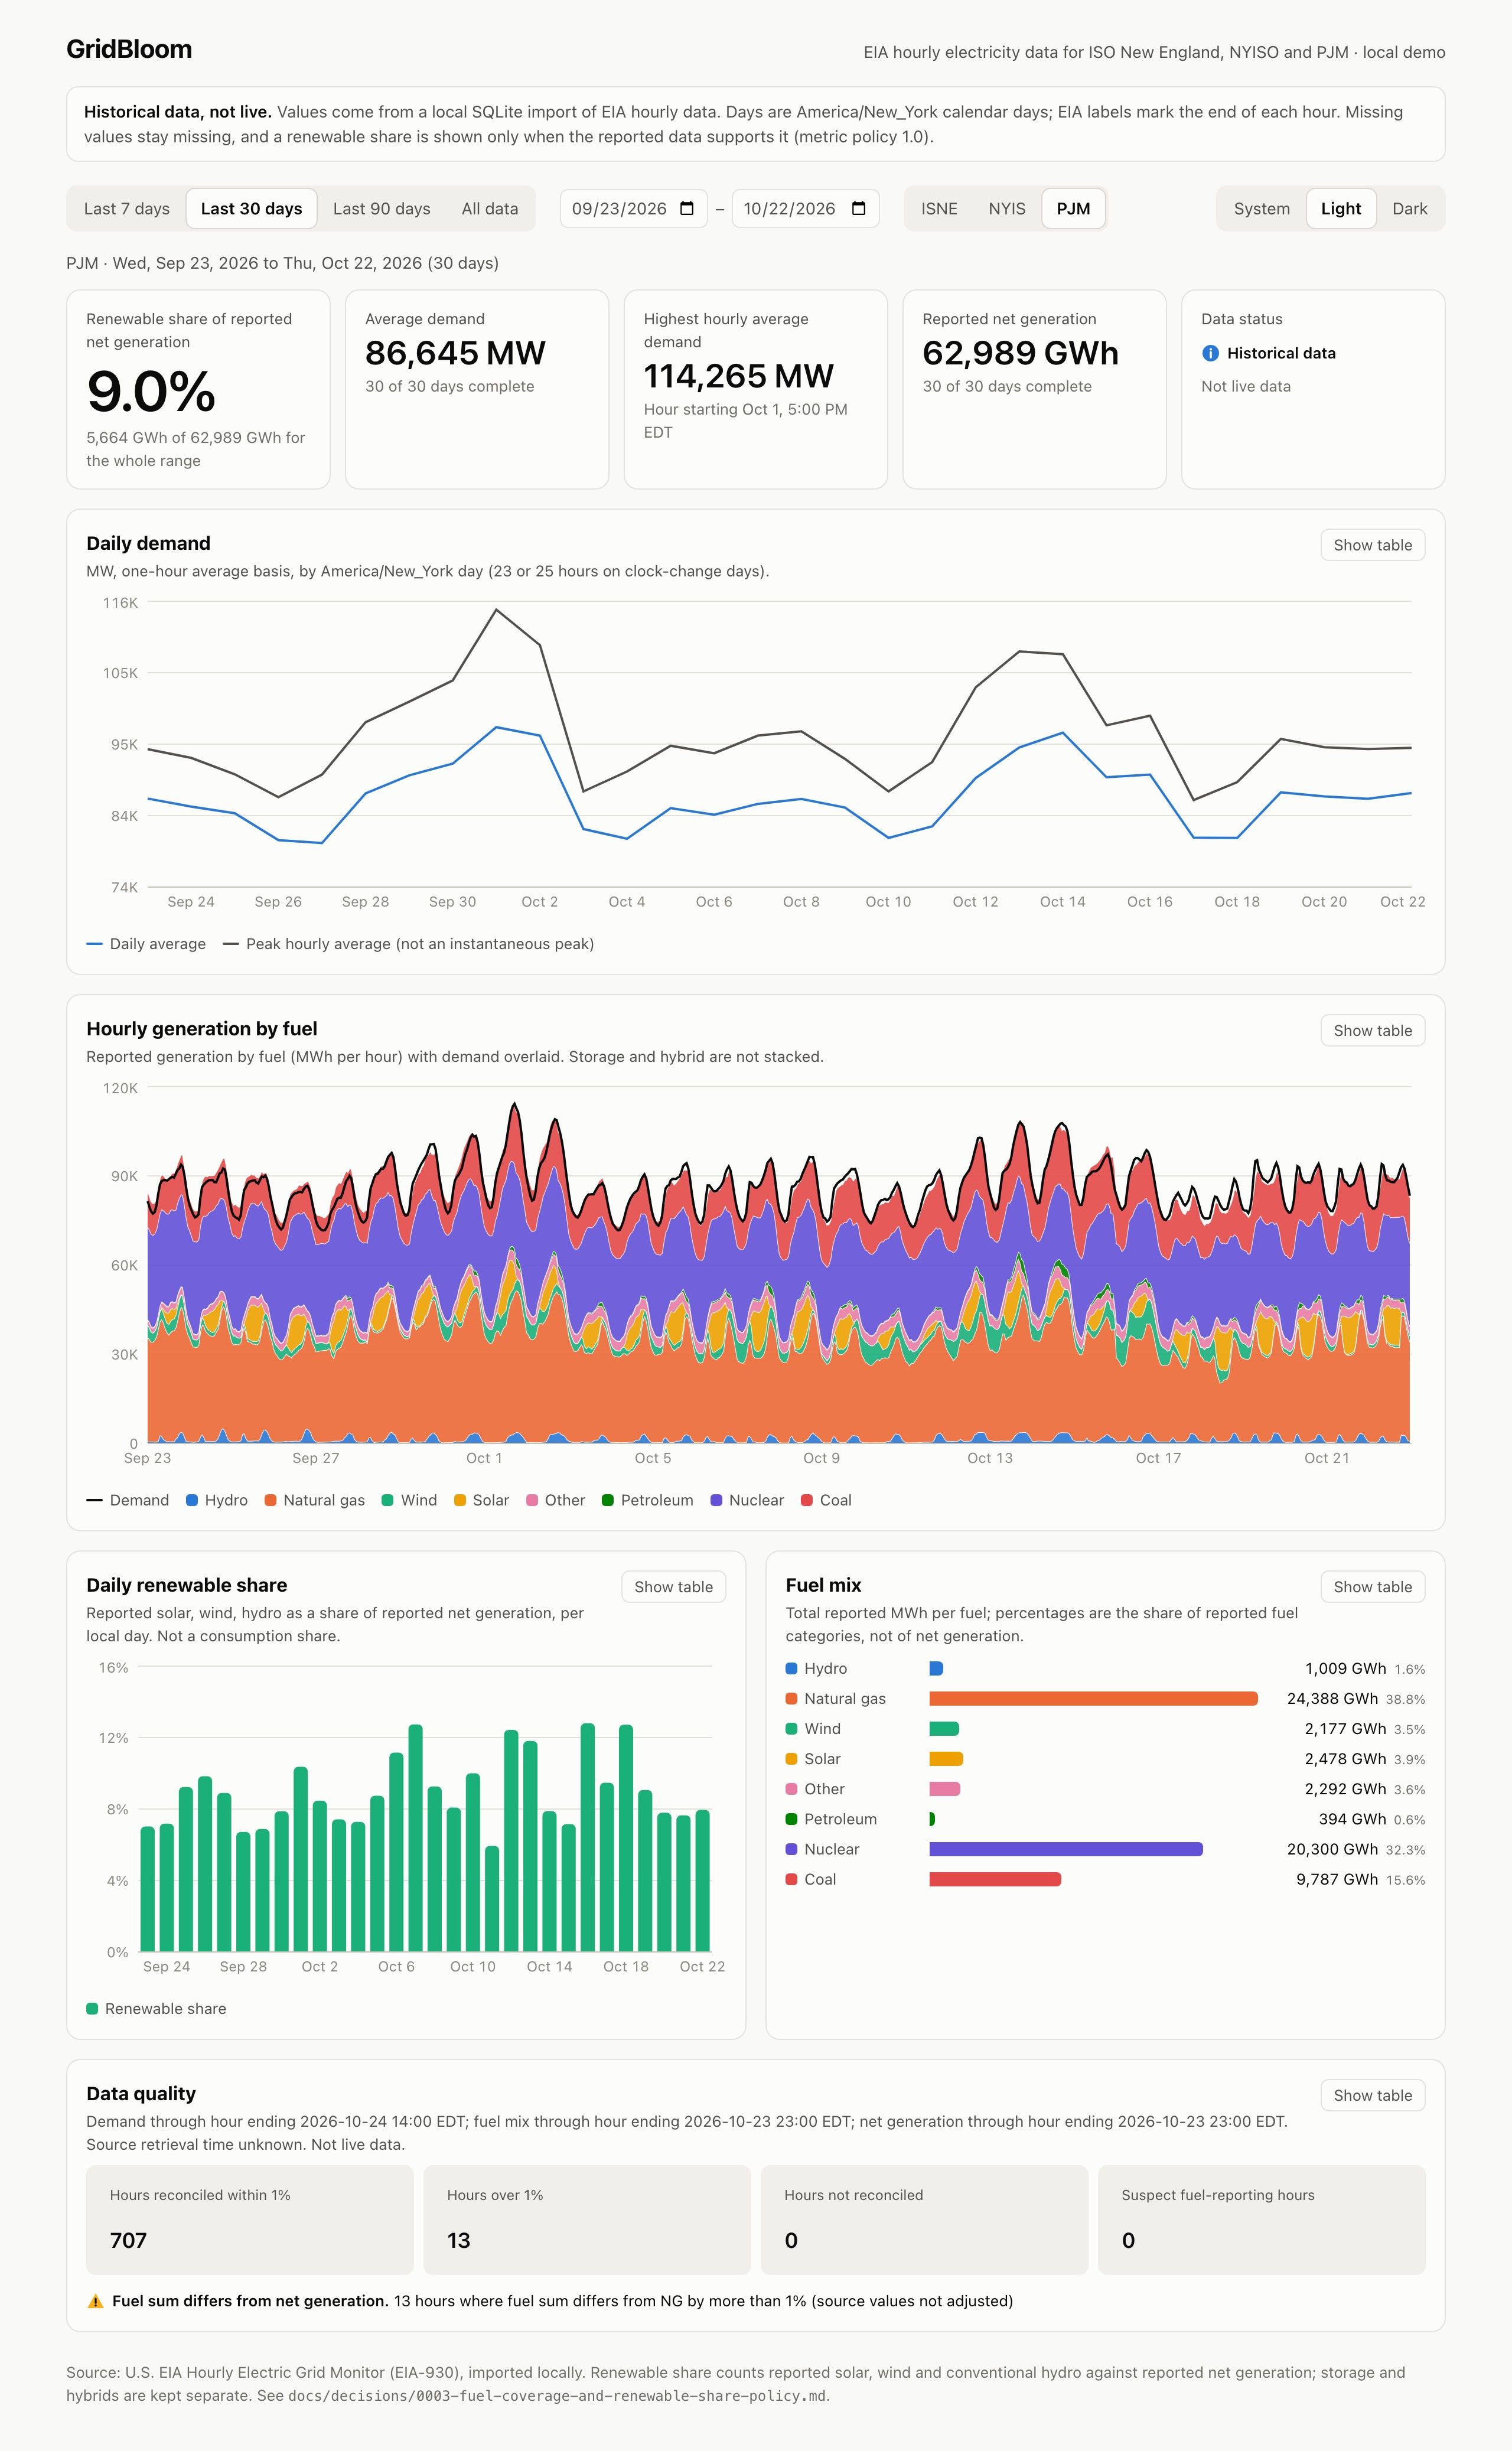
Thirty days of PJM data
Headline figures, daily demand and hourly generation by fuel, September 23 to October 22, 2026.
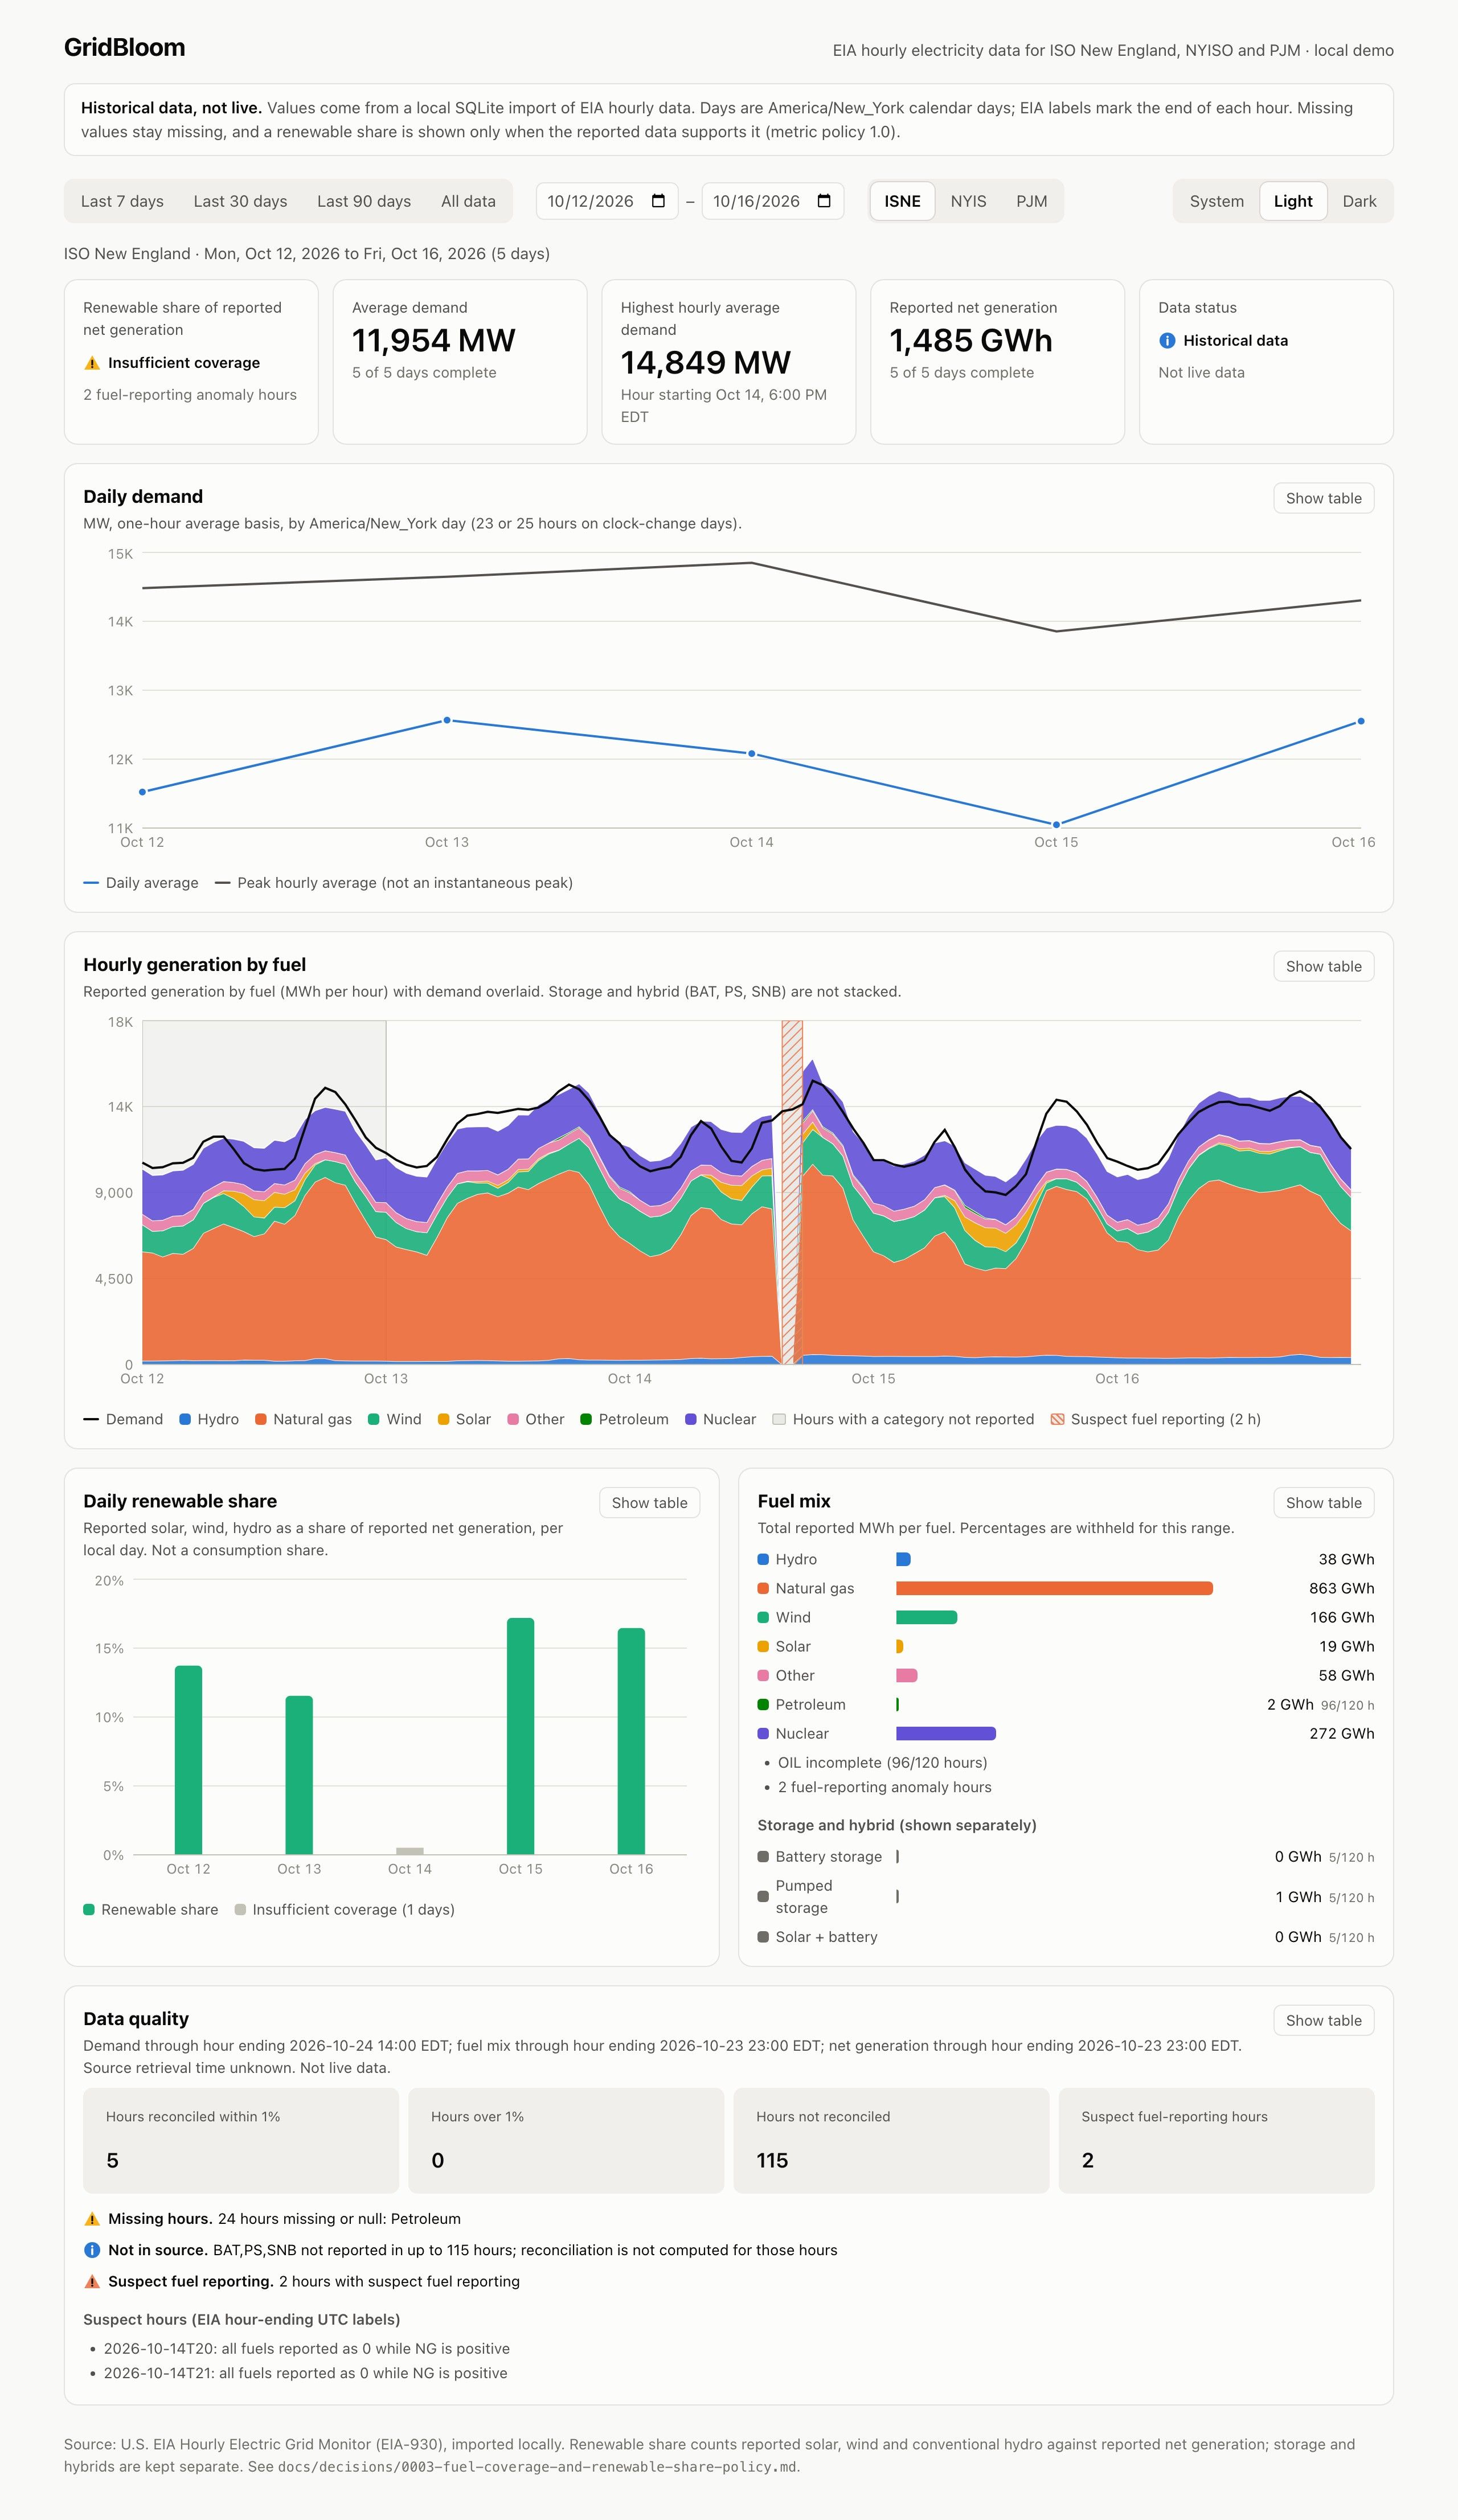
Gaps and suspect hours, marked
ISO New England, October 12 to 16. Shaded hours lack a fuel category; hatched hours are suspect. Fuel-mix percentages are withheld.
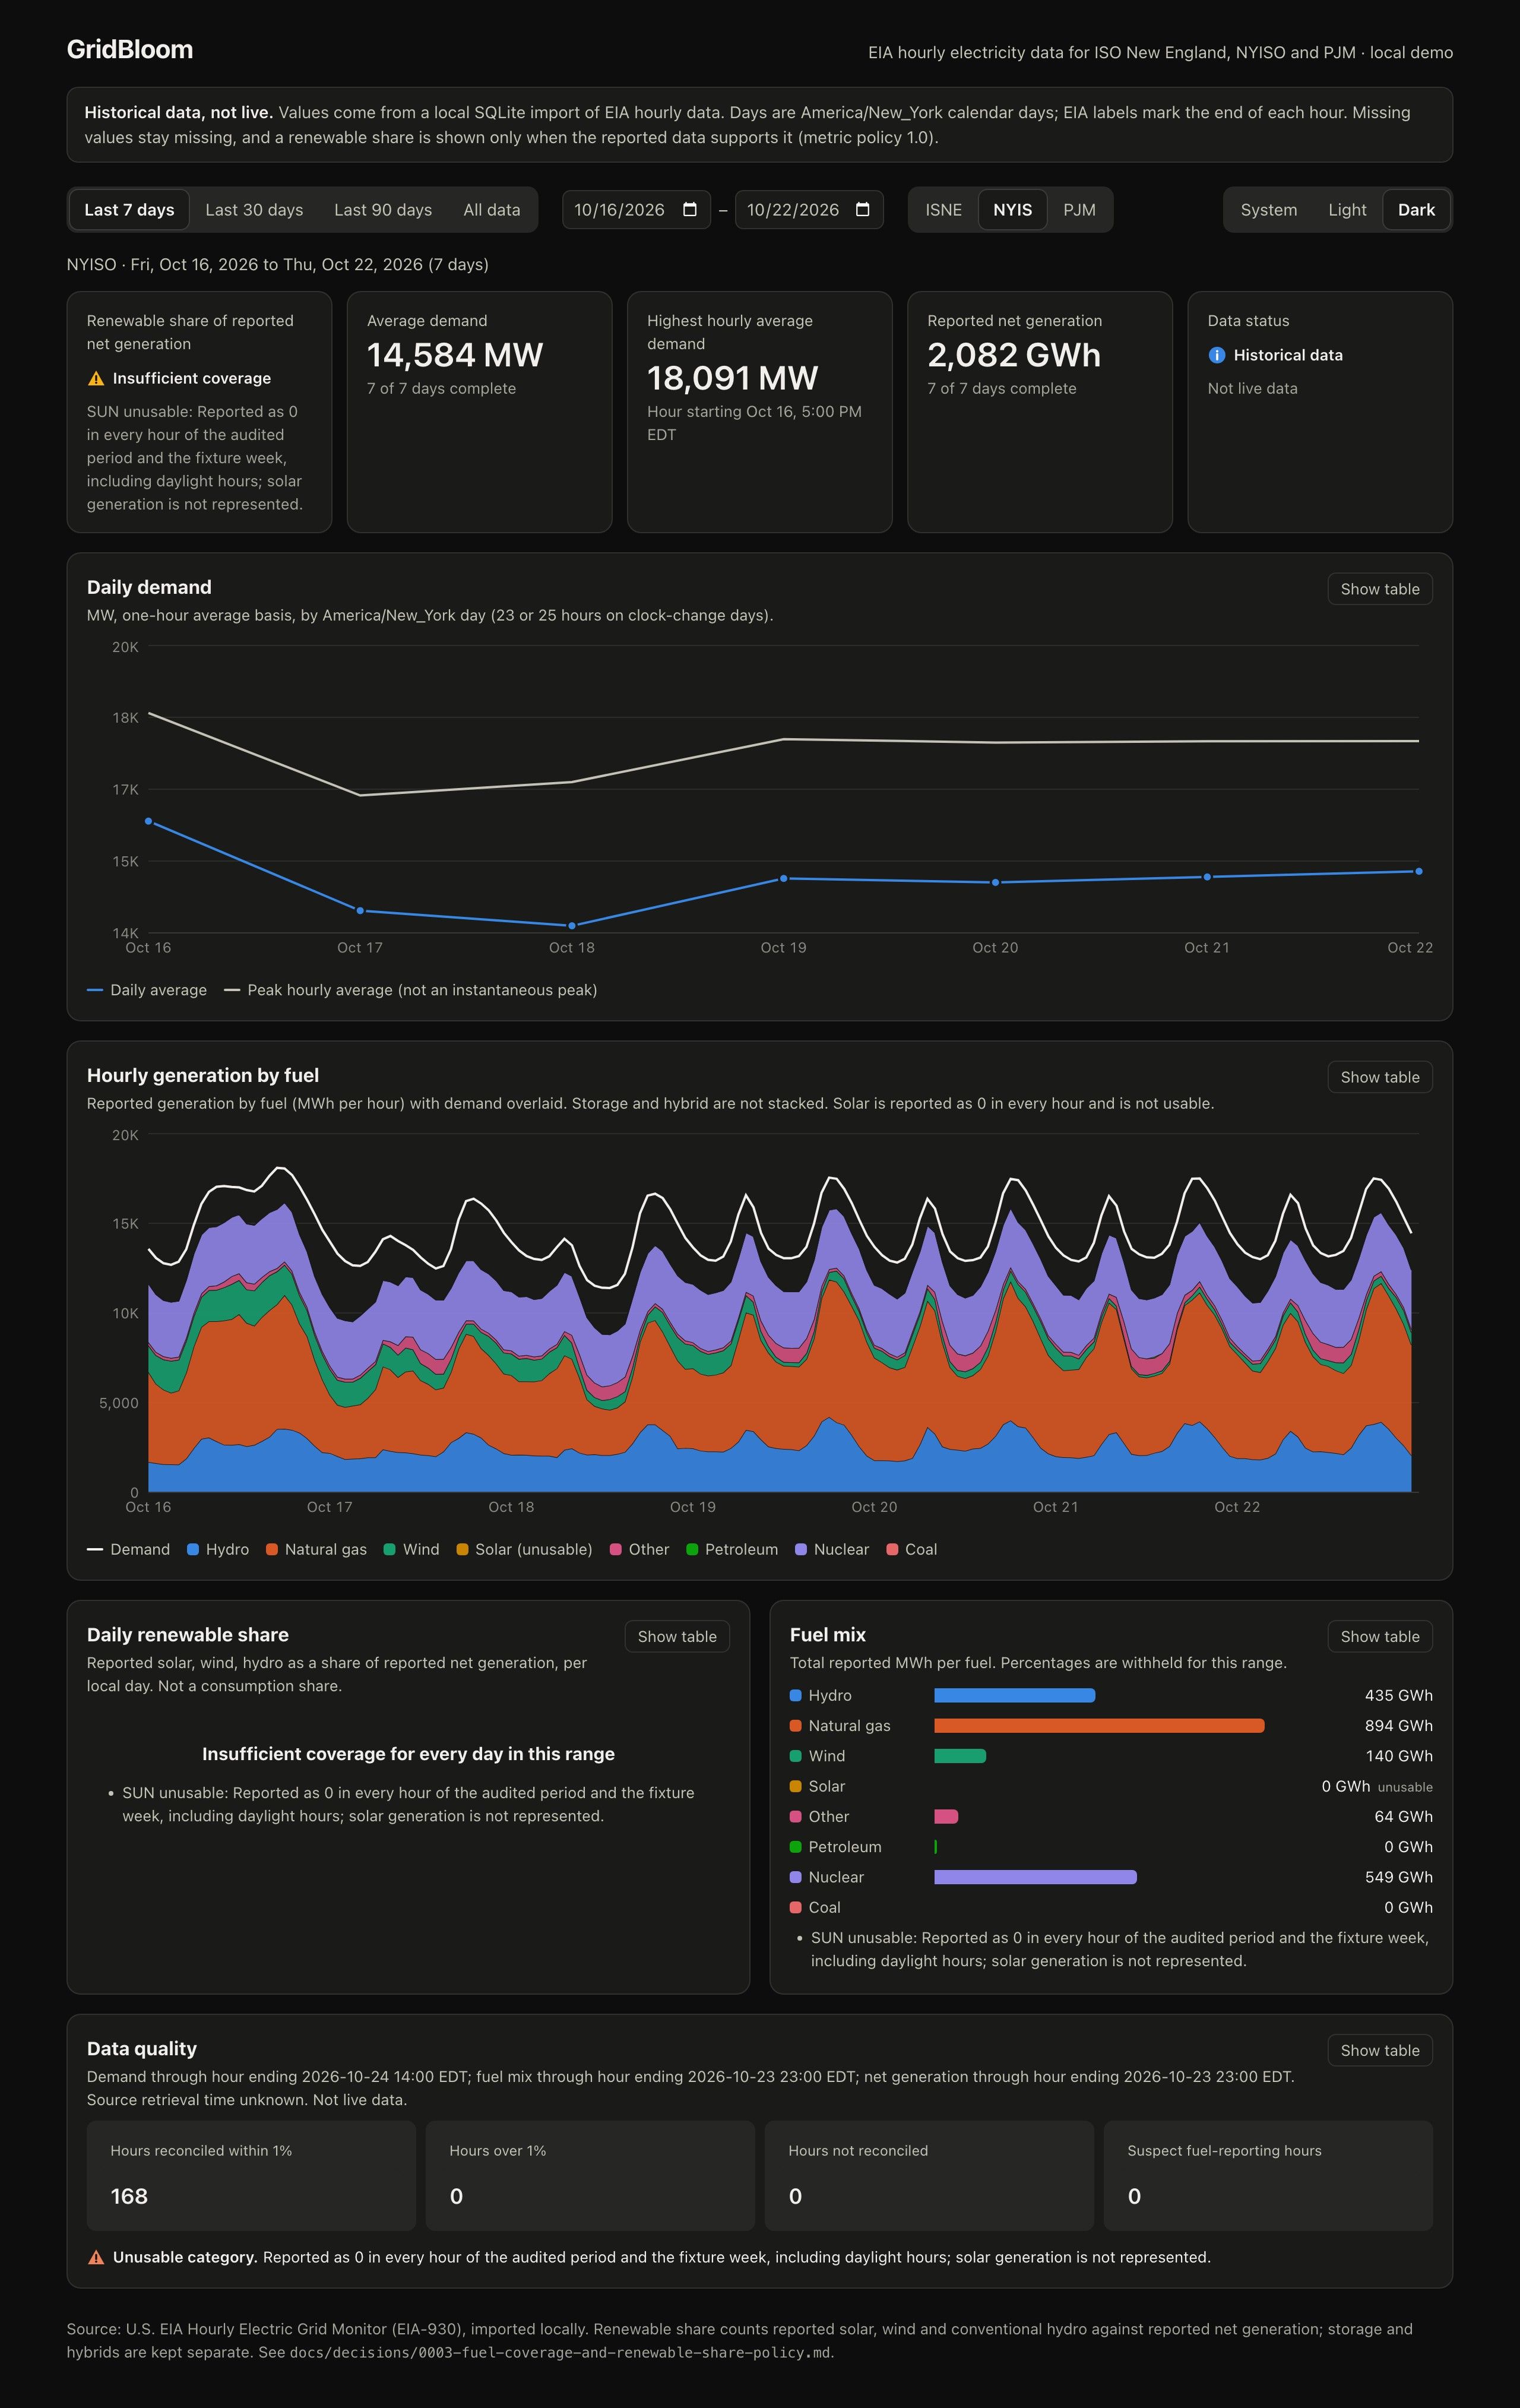
Insufficient coverage, explained
NYISO in dark mode. Solar reads zero in every hour, so the renewable share is withheld with the reason shown.
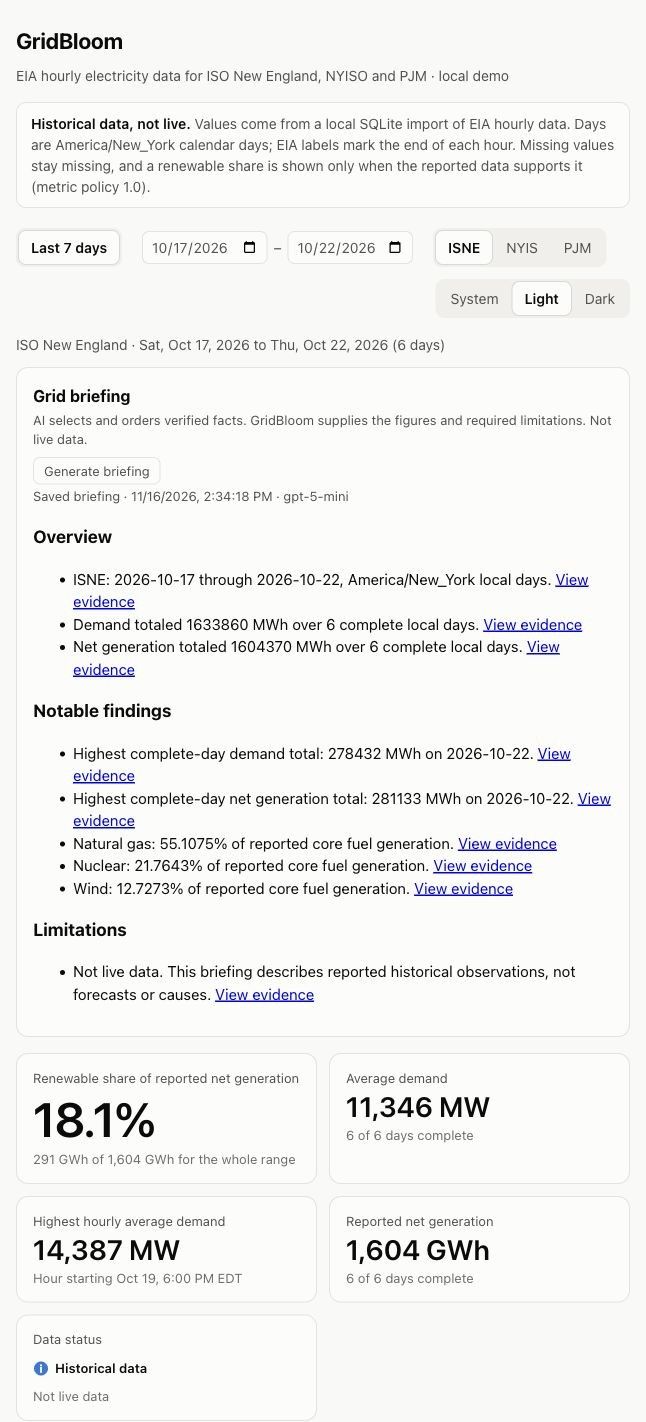
Saved AI briefing
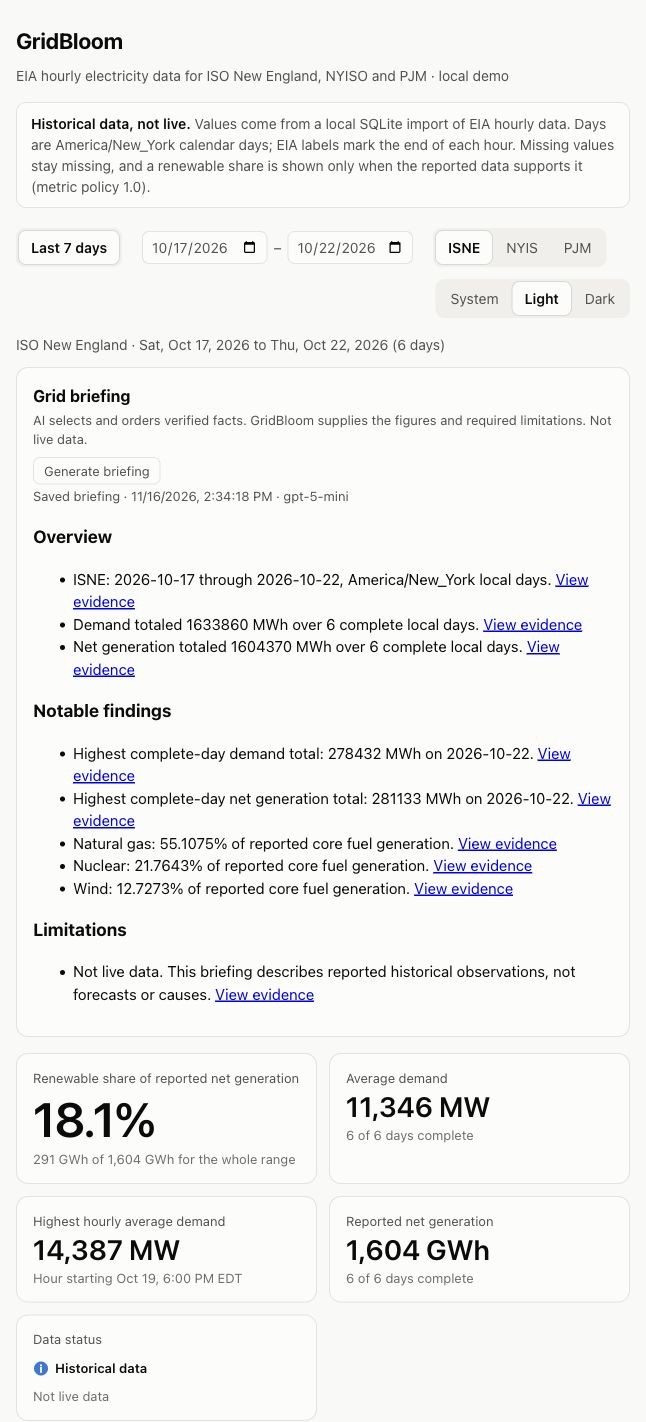
ISO New England, October 17 to 22, 2026. Every line links to its evidence; the limitation can't be removed.
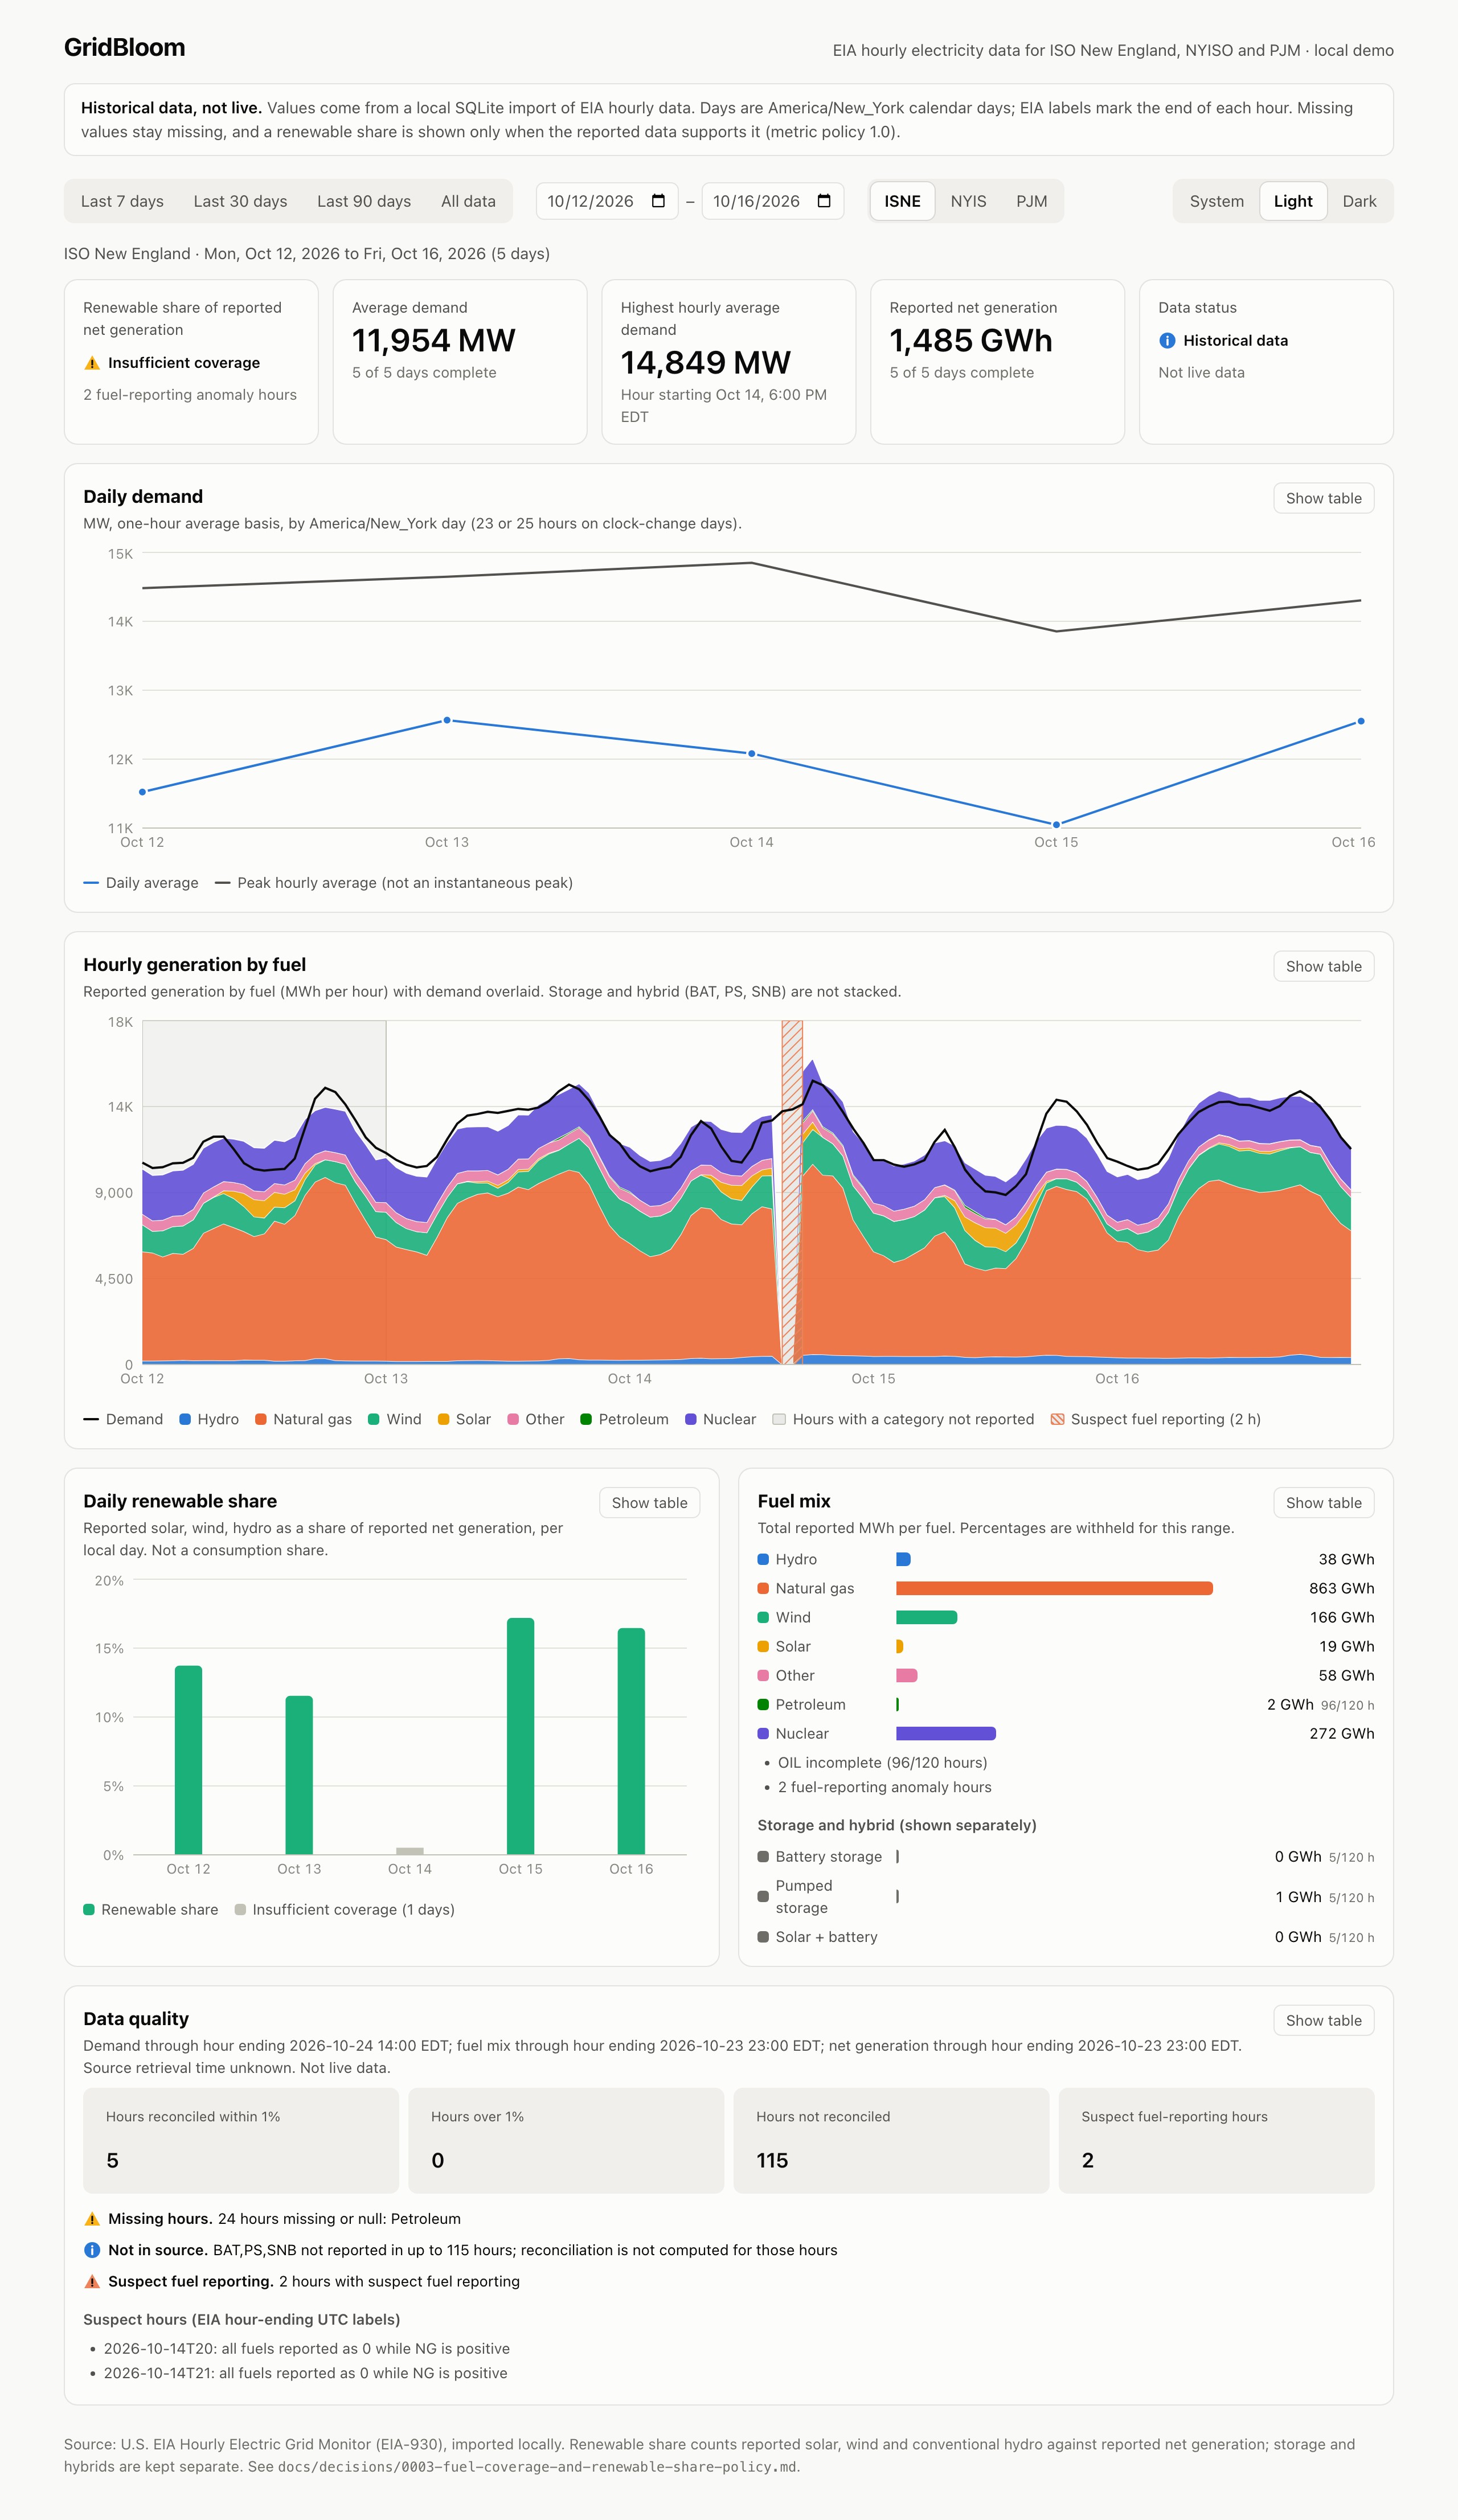
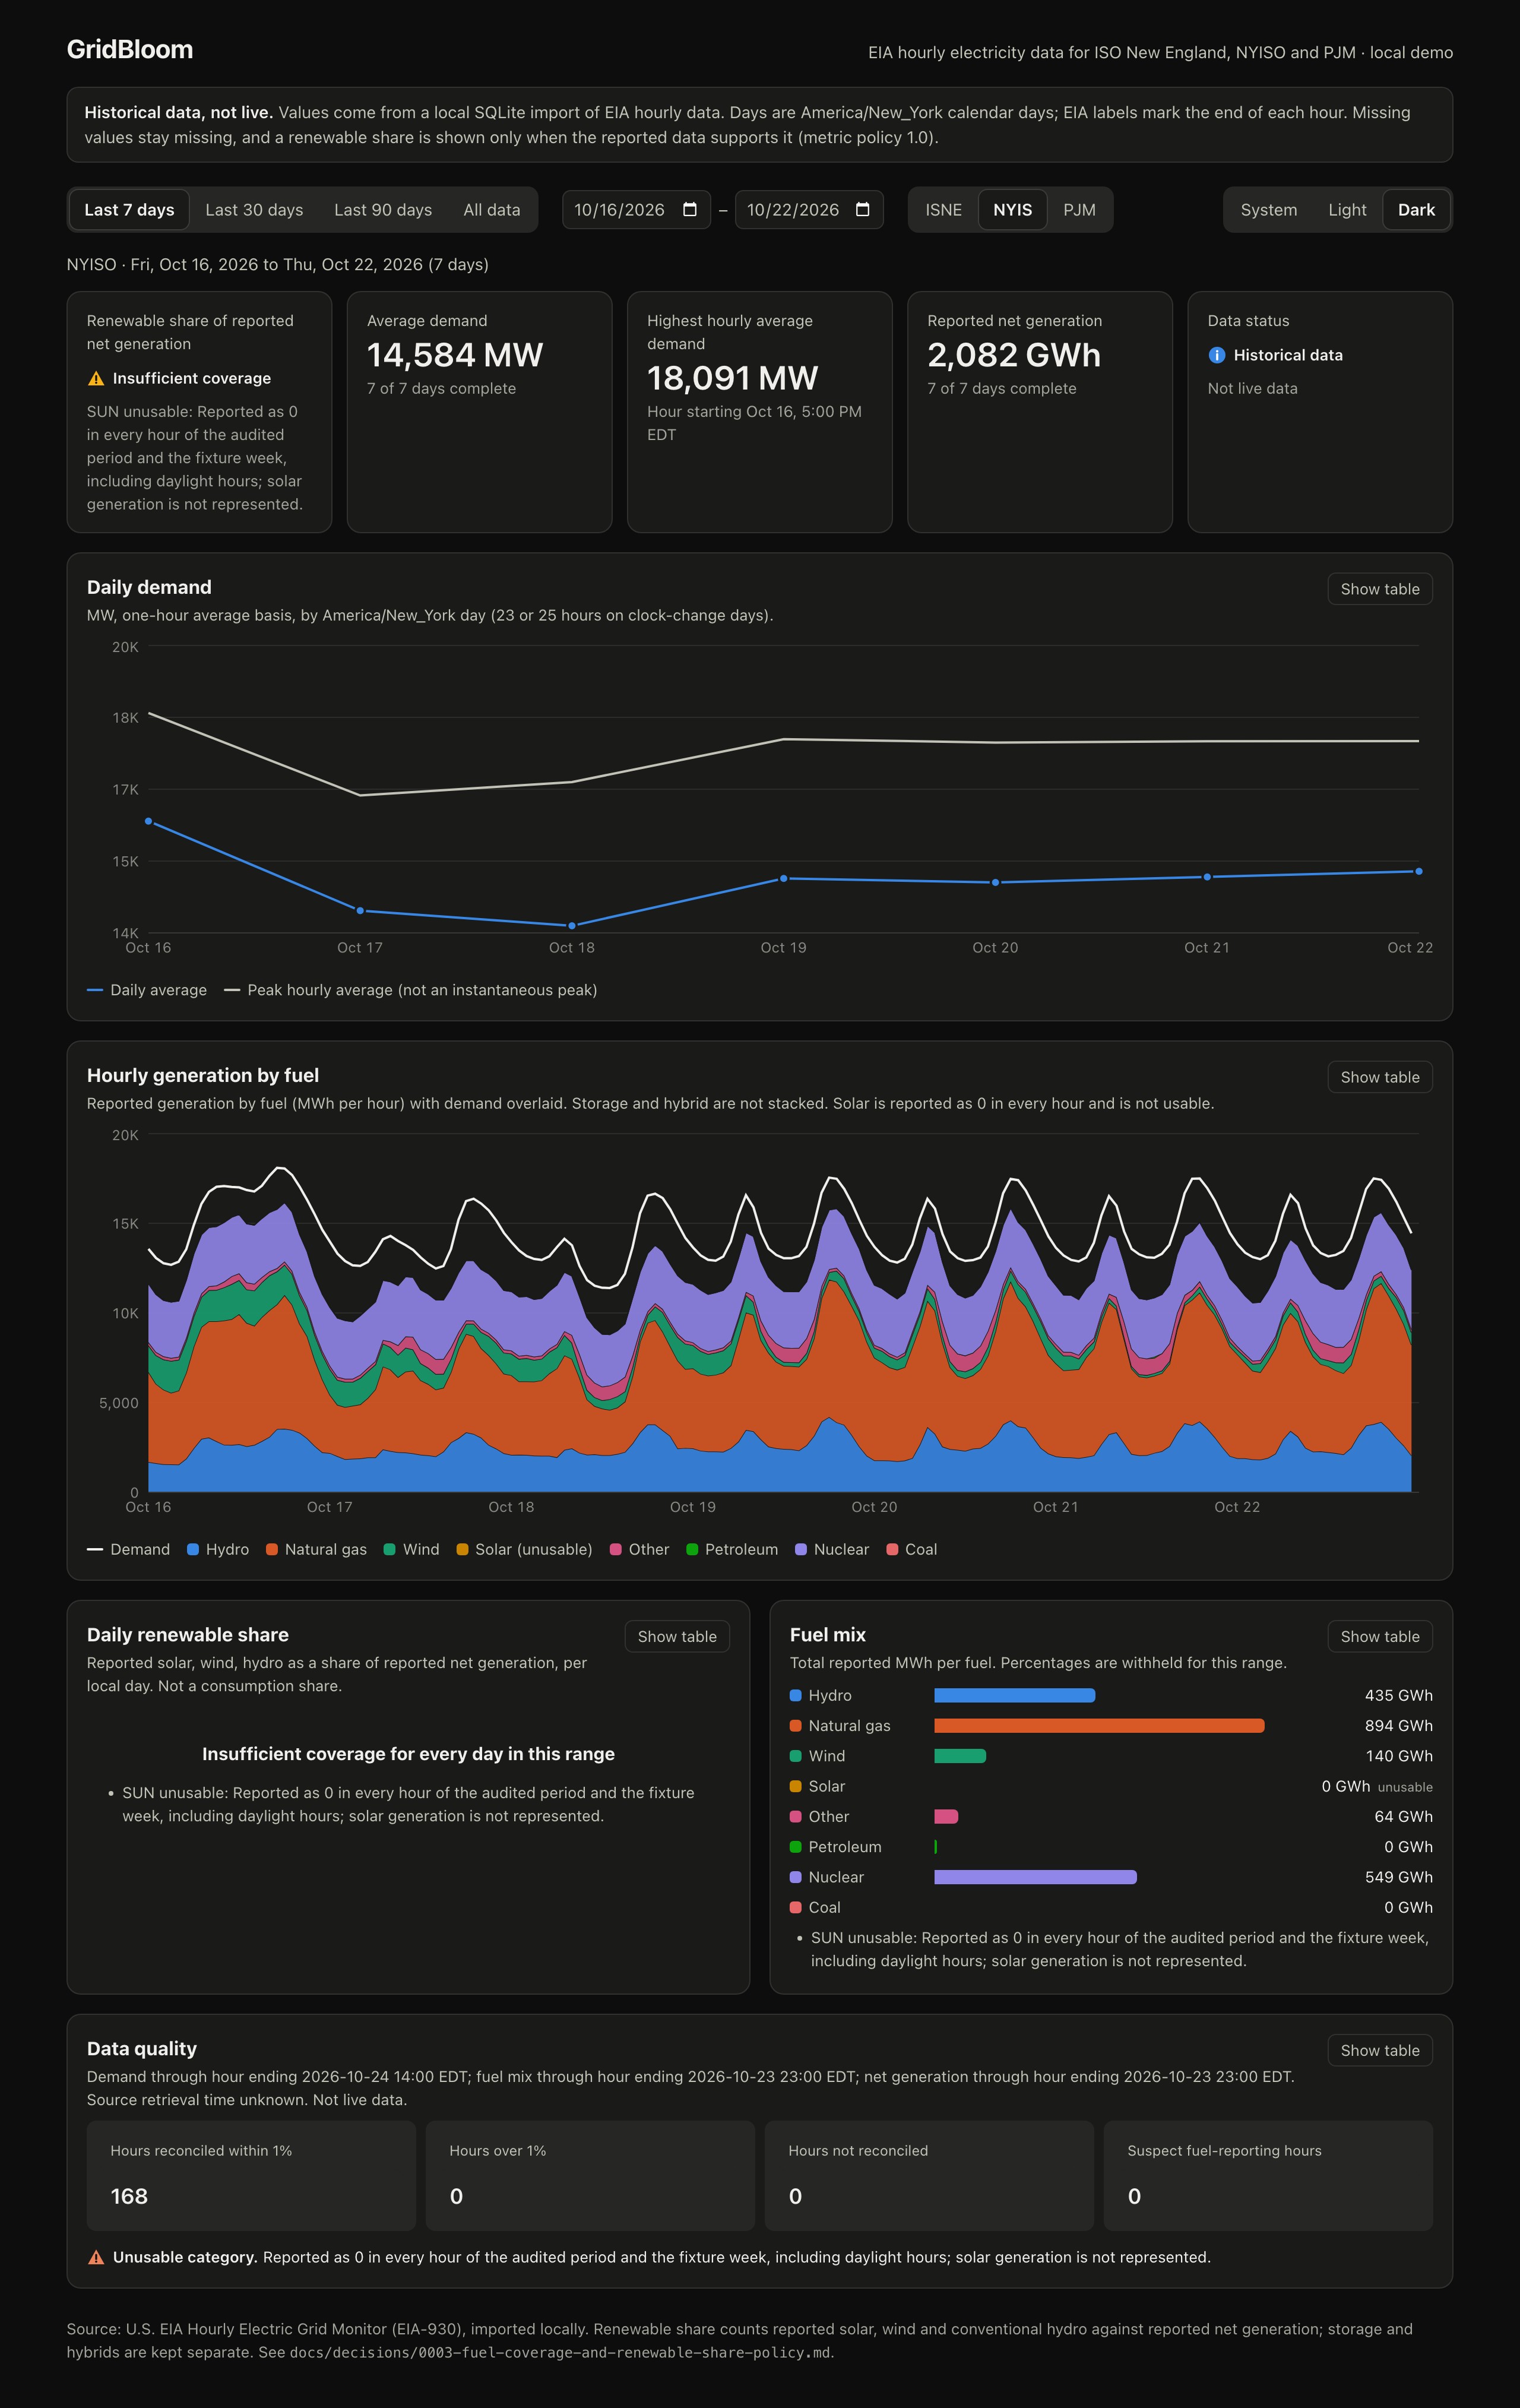
Gaps and suspect hours, marked. ISO New England, October 12 to 16. Insufficient coverage, explained. NYISO's share is withheld with the reason.
An AI briefing that has to show its work
I use AI where it adds real value. Here it picks out what matters and writes the summary, and the system checks every figure it uses.
On request, GridBloom sends approved figures to OpenAI. The model chooses which facts matter most for the period and writes up to four sentences, each citing the facts it relies on.
Before anything is shown, GridBloom checks every sentence:
The model writes up to four sentences, each citing approved facts. Every sentence is checked:
- Every cited fact is one it was givenCited facts must be ones it was given
- Every number and date appears in those facts, so no new sums, ratios or averages get throughEvery number and date must appear in them
- No claims about causes, forecasts or emissionsNo causes, forecasts or emissions claims
- Required caveats, like "insufficient coverage", can't be droppedRequired caveats can't be dropped
One failing sentence withholds the whole analysis, and the card says why. Each citation links to the chart or figure behind it, and reopening the same period reuses the saved result without another model call.
One failing sentence withholds the whole analysis.
5 → 1
In six live test runs, the checks first withheld five of six analyses. Fixing false positives in the checker and the prompt brought that to one of six. The checks were never loosened, and the remaining rejection was a genuine citation error by the model, caught as designed.
Withheld analyses in six live runs, before and after fixing false positives. The checks were never loosened; the last rejection was a real citation error, caught as designed.
A weekly report for people who never open the dashboard
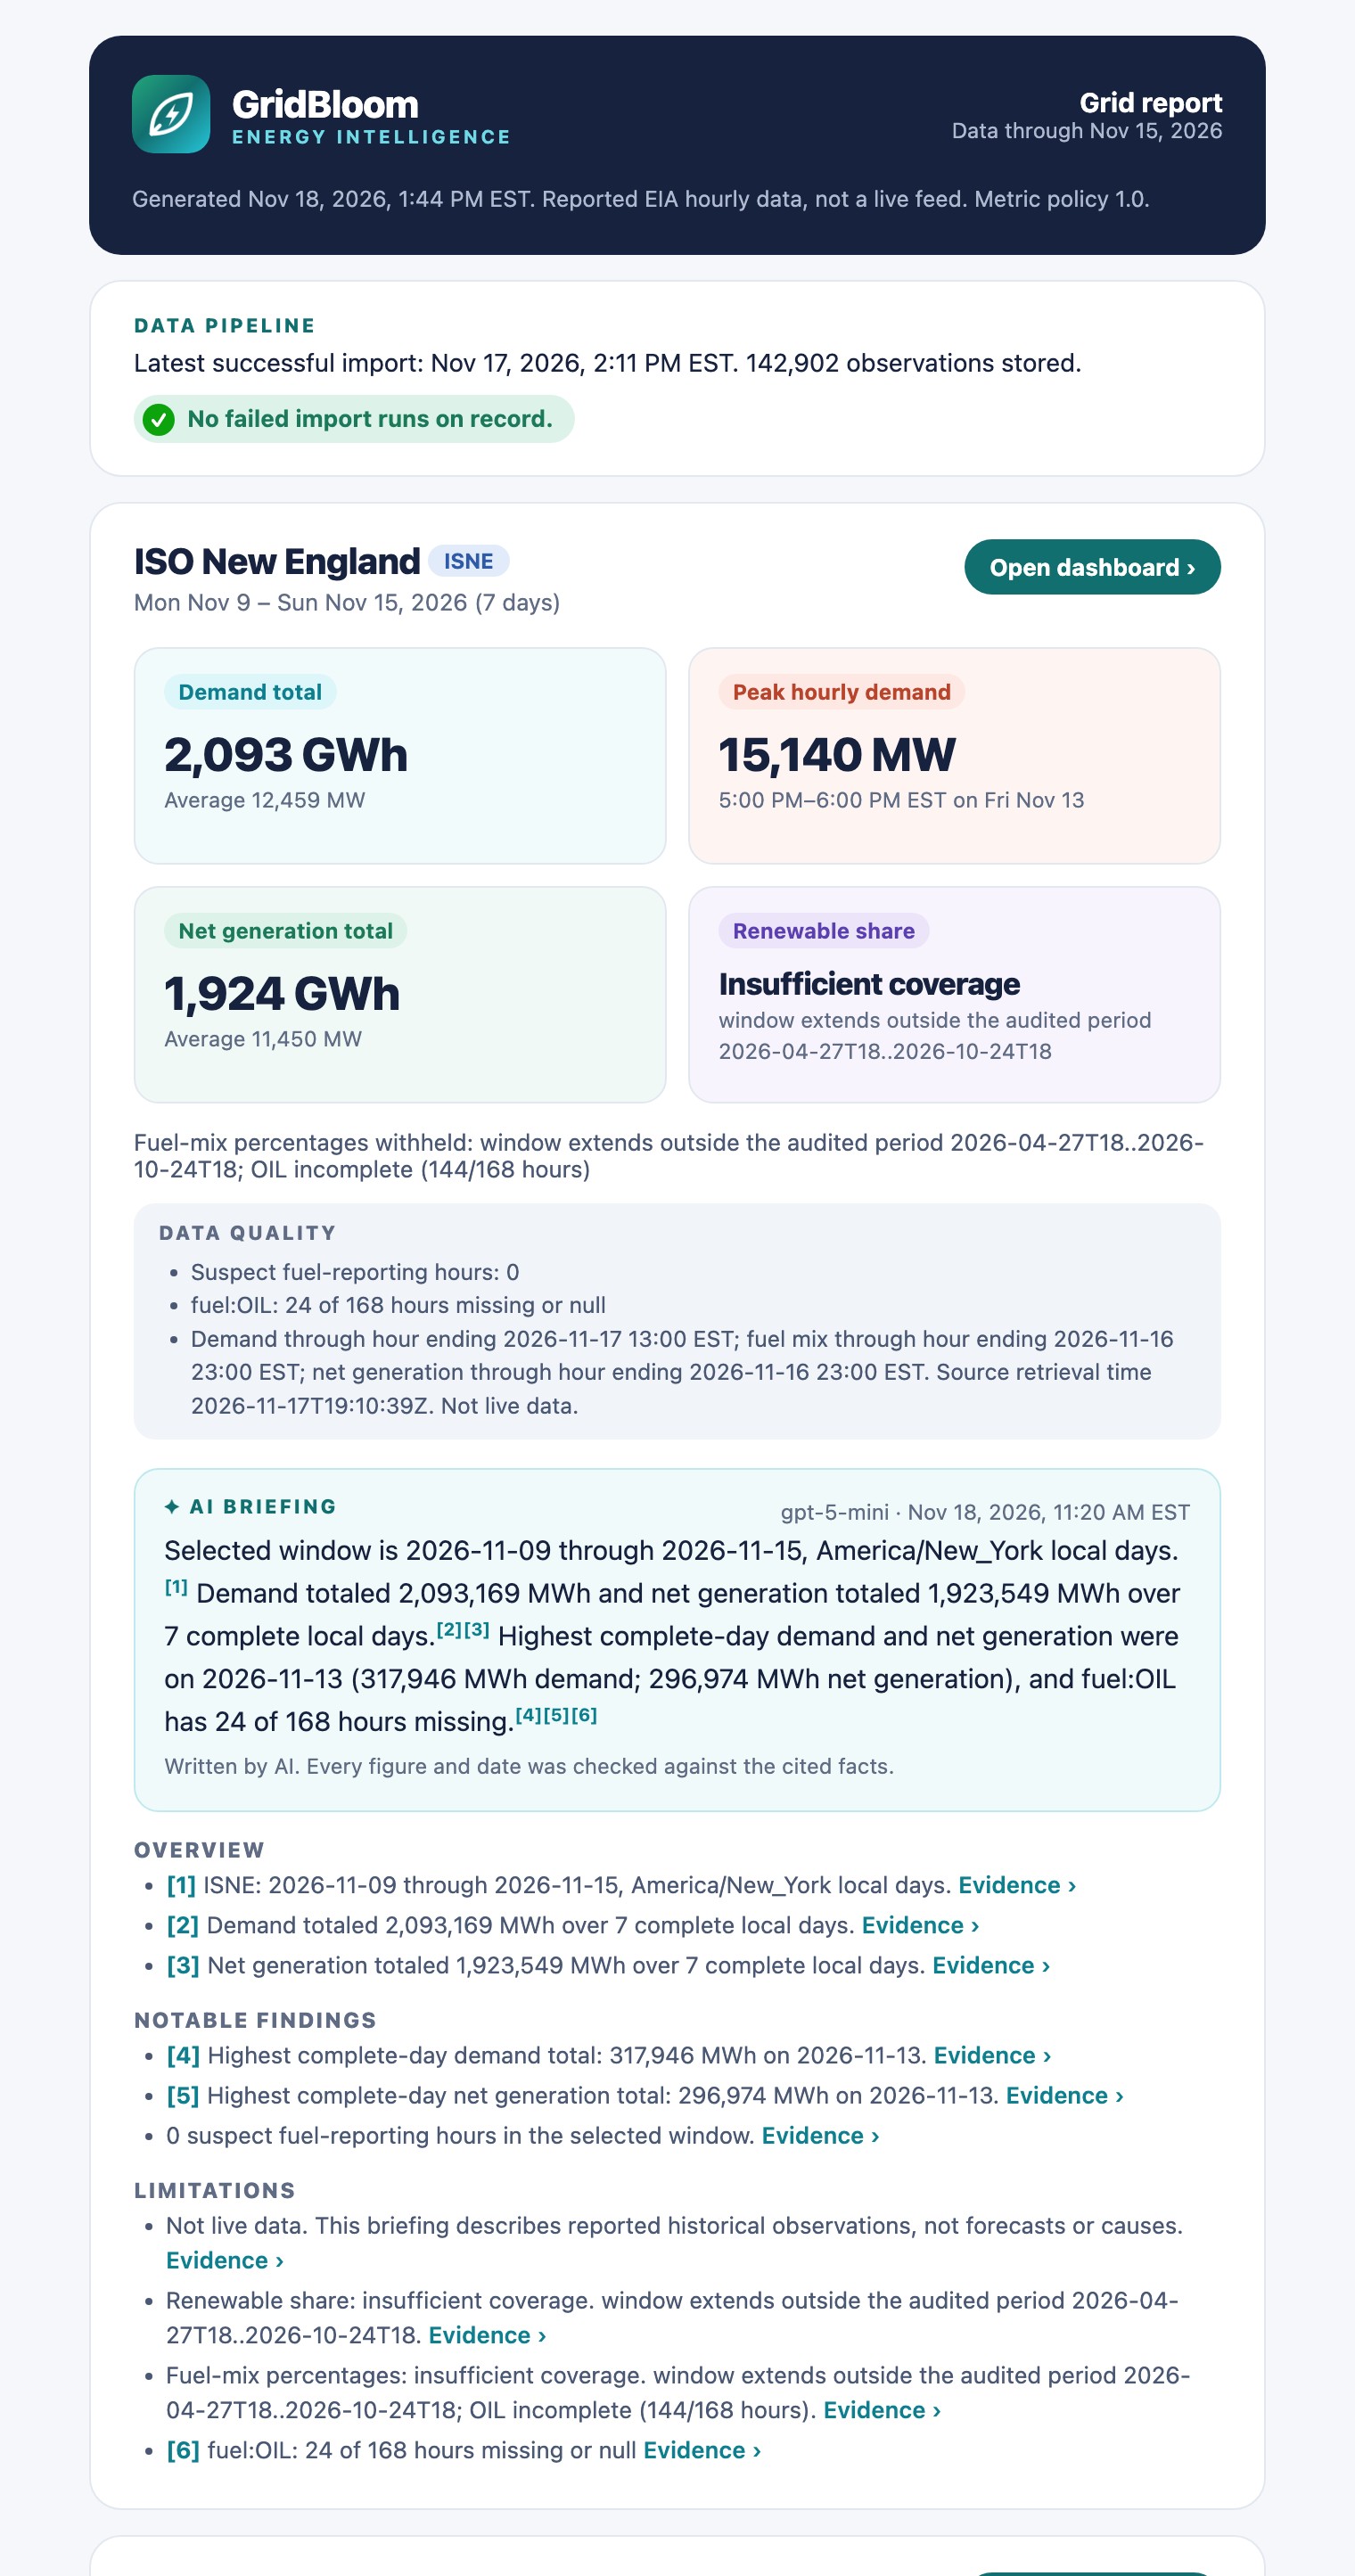
A scheduled job pulls new data and emails a branded report: each region's latest week, its checked AI briefing with numbered citations, and the health of the data pipeline. It uses the same calculation code as the dashboard, so nothing is recalculated for email.
When a week falls outside the audited period, the renewable share reads "Insufficient coverage" with the reason. When an import fails, the email arrives as "Action needed" instead of not arriving at all.
A scheduled email with each region's week, its checked briefing and pipeline health. A failed import arrives as "Action needed" instead of silence.

The same email at phone width. Gmail displays the same layout.

How a weekly report runs
From new source data to an email in the inbox.
Pull new data
Resume from the latest stored hour, looking back to catch revised values.
From the latest stored hour, with a look-back.
Record the import
Count new, revised and unchanged values. A failure is recorded with its reason.
New, revised and unchanged values counted.
Calculate under the policy
The same rules as the dashboard, including withheld figures.
Same rules as the dashboard.
Attach the checked briefing
A saved briefing that passed every check. No AI call unless asked for.
No AI call unless asked for.
Send the report
A branded HTML email that works on desktop and phone.
Branded HTML for desktop and phone.
Flag problems
A failed pull shows up as "Action needed" in the subject line.
"Action needed" in the subject line.
What was verified
| Check | Result |
|---|---|
| Published reference figures | Reproduces the documented seven-day renewable shares exactly: ISO New England 18.6653%, PJM 9.1042% |
| Two sources, one answer | All 4,872 values where the API and bulk data overlap match exactly |
| Repeat imports | Replaying unchanged source data creates no revisions; every run keeps its own audit trail |
| Automated tests | 76 backend and 22 frontend tests passing, plus the production build, covering clock-change days, the 1% boundary and every coverage rule |
| Live AI acceptance | Generation, evidence links, saved reload and NYISO coverage handling checked with a real model |
Published reference figures
Reproduced exactly: ISO New England 18.6653%, PJM 9.1042%
Two sources, one answer
All 4,872 overlapping values match
Automated tests
76 backend and 22 frontend tests passing, plus the production build
Live AI acceptance
Generation, evidence links, saved reload and NYISO coverage handling
GridBloom runs locally as a demonstration. It isn't publicly hosted, and no time savings or production scale are claimed. The test counts describe the revision shown here.
A local demonstration, not publicly hosted. No time savings or production scale are claimed.
The same pattern, your data
Electricity is just the example. The pattern is data from more than one system, rules for when a figure can be trusted and a summary someone relies on every week.
Data from more than one system, rules for when a figure can be trusted, and a summary someone relies on every week.
Accounting firmsAccounting
Monthly client dashboards
Figures from practice and bookkeeping software, with a figure held back until the month is actually closed.
Insurance agenciesInsurance
Book-of-business reporting
Carrier downloads combined into one weekly view of renewals, premiums and gaps that need follow-up.
Law firms
Matter and billing summaries
Time and billing data in a weekly email, with a short AI summary that cites every figure it mentions.
Operations teamsOperations
One weekly operations email
Orders, inventory and support data from separate tools, with a clear flag when a source didn't update.
Nonprofits
Program and grant reporting
Program records turned into funder-ready figures, with missing data shown as missing rather than guessed.
Property managementProperty
Portfolio performance reports
Occupancy, rent and maintenance data from several systems, reconciled before it reaches owners.
Technical detail
- Python
- SQLite
- FastAPI
- React
- Vite
- Recharts
- OpenAI Responses API
- Structured Outputs
- HTML email
Engineering decisions that mattered
Provenance over convenience. Every value records its origin, unit, period, a hash of the raw payload and the import run that brought it in. The source comparison and audit depend on it.
Policy as data. Which fuel categories are usable for each region, and when a share may be published, live in a versioned rules file with a written decision record.
Read-only serving. The dashboard, audit and reporting open the database read-only. Only the importers can write observations.
Missing stays missing. Gaps are shown and explained. Nothing is filled in, smoothed or estimated.
How renewable share is calculated
Reported solar, wind, conventional hydro and geothermal generation, divided by reported net generation. Storage and hybrid categories are kept separate. Period shares use summed megawatt-hours, not an average of hourly shares.
It is a share of generation reported in the region, not of electricity consumed there, and the dashboard says so.
What the data audit found
NYISO: solar is reported as zero in every hour, including daylight, so no NYISO renewable share is published.
ISO New England: petroleum is missing on whole days (864 hours), which withholds fuel-mix percentages. Three hours where every fuel reads zero withhold both percentages.
PJM: no internal gaps, but demand runs 15 hours past the last generation data, so those hours carry no share.
AI integration boundaries
Briefings are generated only when someone asks. The model returns a strict structured response, and anything referring to an unknown fact, a duplicate or a missing required limitation is rejected. The API key stays on the server and never reaches the browser.
A separate cache keeps each result with its inputs, model, prompt version, usage and generation time. Automated tests mock the provider; real generation was checked separately during acceptance.
Running it
GridBloom runs on a laptop. The analytics need no cloud services or API keys; an OpenAI key is needed only to generate new briefings, and email settings only for the report. Source code is private.
Engineering decisions
Every value keeps its source, unit, raw-payload hash and import run. Coverage rules live in a versioned policy file. The dashboard, audit and report read the database read-only. Missing stays missing.
How renewable share is calculated
Reported solar, wind, conventional hydro and geothermal over reported net generation, using summed megawatt-hours. Storage and hybrids are kept separate. It's a share of generation, not of consumption.
What the data audit found
NYISO solar reads zero in every hour, so no NYISO share is published. ISO New England petroleum is missing for 864 hours. PJM demand runs 15 hours past its last generation data.
AI integration and running it
Briefings run only on request, with a strict structured response; the key never reaches the browser. Results are cached with model, prompt version and usage. Everything else runs on a laptop with no API keys. Source code is private.
Have reports you don't fully trust?
Tell me where your figures come from, who reads them and what goes wrong today. We can talk about a reporting workflow that checks itself and tells you when it can't.
Tell me where your figures come from, who reads them and what goes wrong today.
See other case studies